I tried to use ELK( ElasticSearch, Logstash and Kibana) to analyse the log and pushed them to Kibana and build a representation.
Most steps are listed in the some tutorials like this or this one for iis log
I aimed at analysing the iis log,What I downloaded are
- ElasticSearch 2.2
- Logstash 5.0.0 alpha (not sure why the version jumped to 5???)
- Kibana 4.5.1 Window
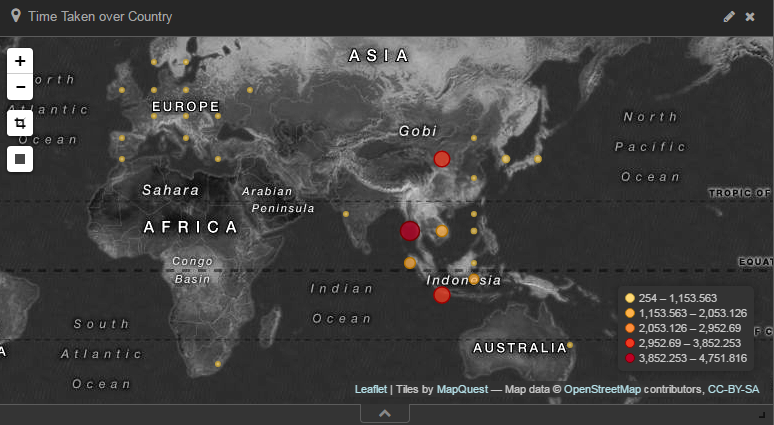 GeoIp with User Distrubution
Although I followed the tutorial and copy log parser for iis, but it didn’t work. Using grok debuuger may help.
Eventaully my analysis pattern look like
grok {
	match => ["message", "%{TIMESTAMP_ISO8601:timestamp} %{WORD:filename} %{NOTSPACE:ComputerName} %{IPORHOST:hostip} %{WORD:method} %{URIPATH:page} %{NOTSPACE:query} %{NUMBER:port} %{NOTSPACE:username} %{IPORHOST:clientip} %{NOTSPACE:httpver} %{NOTSPACE:useragent} %{NOTSPACE:Cookie} %{NOTSPACE:Referer} %{NOTSPACE:Host} %{NUMBER:http_response} %{NUMBER:sub_response} %{NUMBER:sc_status} %{NUMBER:time_taken}"]
}
And add GeoIp database to convert ip to geo position.
geoip {
    source => "clientip"
    target => "geoip"
    database => "X:/GeoLite2-City.mmdb"
    add_field => [ "[geoip][coordinates]", "%{[geoip][longitude]}" ]
    add_field => [ "[geoip][coordinates]", "%{[geoip][latitude]}"  ]
}
Some tutorial used GeoLiteCity.dat, but GeoLiteCity.dat didn’t work for my logstash, which always threw exception of wrong format.
And I downloaded GeoLite2-City.mmdb from their website
For the data that need to be converted as number, adding them in mutate part
mutate {
    remove_field => [ "log_timestamp"]
    convert => [ "[geoip][coordinates]", "float"]
    convert => ["bytesSent", "integer"]
    convert => ["bytesReceived", "integer"]
    convert => ["time_taken", "integer"]
}
Template for Log
Confuguring the template is most important thing to do here, since once the data or indice is created, the mapping can’t be changed. Although there are some 3rd party software can backup index, it stil takes much time.
configure the template for index to convert the data with properly typing, or most property are string.
In the above tutorial,it asked to download a template and make it as default template for index of logs.
To Modify type, adding some property in the template request body, and final template I used is
    {
   "iislog_template": {
      "order": 0,
      "template": "iislog*",
      "settings": {
         "index": {
            "number_of_shards": "2"
         }
      },
      "mappings": {
         "_default_": {
            "dynamic_templates": [
               {
                  "message_field": {
                     "mapping": {
                        "index": "analyzed",
                        "omit_norms": true,
                        "type": "string",
                        "fields": {
                           "raw": {
                              "ignore_above": 256,
                              "index": "not_analyzed",
                              "type": "string"
                           }
                        }
                     },
                     "match_mapping_type": "string",
                     "match": "message"
                  }
               },
               {
                  "string_fields": {
                     "mapping": {
                        "index": "analyzed",
                        "omit_norms": true,
                        "type": "string",
                        "fields": {
                           "raw": {
                              "ignore_above": 256,
                              "index": "not_analyzed",
                              "type": "string"
                           }
                        }
                     },
                     "match_mapping_type": "string",
                     "match": "*"
                  }
               }
            ],
            "properties": {
               "@timestamp": {
                  "type": "date"
               },
               "geoip": {
                  "dynamic": true,
                  "type": "object",
                  "properties": {
                     "location": {
                        "type": "geo_point"
                     }
                  }
               },
               "offset": {
                  "type": "long",
                  "doc_values": "true"
               },
               "message": {
                  "index": "analyzed",
                  "type": "string"
               },
               "time_taken": {
                  "index": "analyzed",
                  "type": "long"
               },
               "timestamp": {
                  "format": "yyyy-MM-dd HH:mm:ss",
                  "index": "analyzed",
                  "type": "date"
               }
            }
         }
      },
      "aliases": {}
   }
}
And the index should be indexed then it can be applied in visualization, and the part of dynamic_templates is quite critical. It makes the field typed as string that retained 2 field in data, one is original one ended with .raw, the other is analyzed one.
Why this is important? because ElasticSearch by its nature is a search engine, it analyzed and tokenized all string it get. The problem here come, that url like http://example.com/ it considered it as “http”,”example”,”com”,”web”..ect. It’s unfavorable when we want to see the url as a whole, so we need to use .raw version. And there is a warning in Kibana as well, the analyzed one usually is not suit for plotting.
If using the version analyzed,you encountered the error in Kibana
 Error in Kibana
Changing to use .raw version, it’s a correct one.