confusion matrix format:
 1589 ,1893 ,1412,   63,  452,   17,  406,  187,  471,  203,  178, 1116,  799,   53,  100,  223 , 137 ,  31, 240 , 206 , 582 , 267 ,  59, 1750 ,  76 ,  99 ,  46 ,1150 ,  55 ,1019
  522 ,2998 ,1920,   77,  428,    9,  379,  131,  199,  237,  145,  453,  491,   30,   60,  521 , 192 ,  28, 112 , 121 , 264 , 111 ,  84, 1461 ,  95 , 167 ,  44 , 808 ,  14 , 699
...
There is 30 * 30 matrix
require(ggplot2)

input <- read.delim("confusion.csv", header=FALSE, sep=",")
input.matrix <- data.matrix(input)

colnames(input.matrix) = c("tired","happy","excited","bouncy","confused","awake","accomplised","anxious","sick","crazy","sad","exhuasted","bored","cold","lonely","loved","hopeful","hungry","crappy","busy","stressful","frustrated","relaxed","amused","content","cheerful","calm","contemplative","sleepy","depressed")
rownames(input.matrix) = colnames(input.matrix)

confusion <- as.data.frame(as.table(input.matrix))

plot <- ggplot(confusion)
plot + geom_tile(aes(x=Var1, y=Var2, fill=Freq)) + scale_x_discrete(name="Actual Class") + scale_y_discrete(name="Predicted Class") + scale_fill_gradient(breaks=seq(from=-.5, to=10, by=.2), low = "#581845", high = "#ffc300") + labs(fill="Normalized\nFrequency")
the last line low = “#581845”, high = “#ffc300” indicates that the color for highest value.
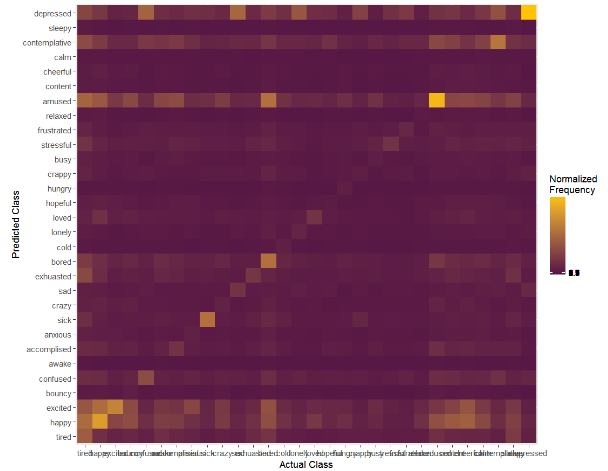 Confusioin Matrix